
The Dependency Audit
Why Every Library, Framework, and Vendor on Your Stack Has a Cost You Never Wrote Down

The CFO asked a simple question. The architect could not answer it.
“What does it cost us to keep this system running, all-in, per year?”
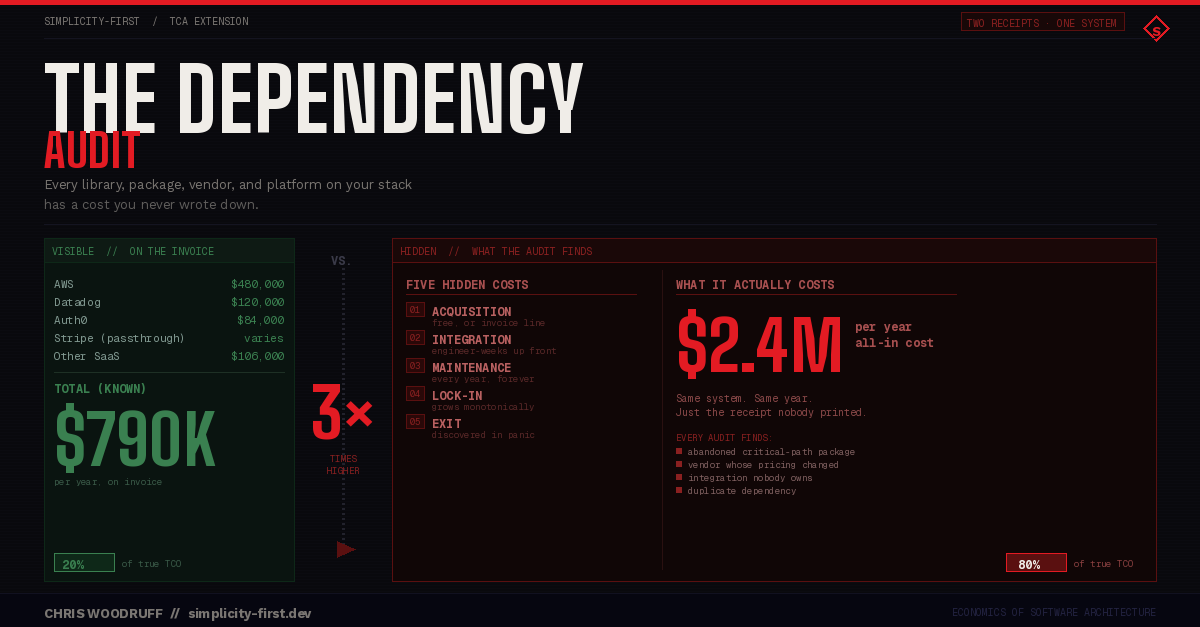
The architect began with the straightforward number. AWS: $480,000 per year, clearly listed on the invoice. SaaS subscriptions followed: Datadog at $120,000, Auth0 at $84,000. Stripe took a passthrough percentage unlisted in the engineering budget, but integration support costs $40,000 annually. Snyk, Sentry, PagerDuty and LaunchDarkly rounded out the SaaS group at $310,000.
That was only the beginning.
Next, the architect counted open-source dependencies. The package manifest listed 847 transitive packages. Most posed no issues. Forty-three were critical. Four were abandoned; the last commit was eighteen months ago; security advisories are open. Six carried license terms that were not reviewed by legal. Two caused production incidents, each consuming 90 engineer-hours to fix.
Then came language runtimes, build tools, CI/CD vendors, the observability stack, and API integrations with partners whose terms could change with 60 days’ notice.
Three weeks of inventory yielded one number for the CFO.
$2.4 million per year. All-in. Against an AWS bill of $480,000.
The CFO blinked. “So our cloud bill is 20% of what this system actually costs to run?”
The architect nodded.
The remainder of the meeting was marked by palpable tension.
The 80% That Was Always There
Every system in production has two cost structures. The visible one lives on invoices: cloud, SaaS, infrastructure procurement, license fees. Accounting tracks it well because money flows out of the organization through systems built to track it.
Invisible costs include engineering capacity, opportunity costs, strategic flexibility, and integration debt from hundreds of decisions nobody priced. These are real, paid yearly, and absent from invoices because accounting lacks visibility.
The architect in the opening example delivered a clear summary: the visible costs were 20%, while the invisible costs made up the remaining 80%. This was the organization’s first complete accounting of its system’s true cost.
Accounting functions as designed. The failure lies elsewhere: organizations make architectural decisions—library, vendor and service choices—based solely on the visible 20%. The invisible 80% is never discussed and is absent from any spreadsheet.
The Dependency Audit accounts for 80% of the costs.
What Counts as a Dependency
The audit covers more than package.json. Five categories sit inside the scope, each with its own economic character.
Code dependencies. The open-source libraries and packages that ship in the deployed artifact. The visible cost is approximately zero. The hidden costs include security maintenance, version upgrade cycles, breaking change migrations, license compliance, and the operational risk of a critical package being abandoned by its maintainer.
Runtime dependencies: Language runtimes, databases, message brokers, caches, and search engines. Visible cost: cloud bill. Hidden costs: operational expertise, upgrade work, and system lock-in as features rely on each runtime’s quirks.
Vendor SaaS dependencies. Stripe, Datadog, Auth0, Twilio, SendGrid, Snyk. The visible cost is the monthly invoice. The hidden costs are the integration code, the engineer time spent on vendor API changes, the operational dependence on the vendor’s uptime, and the switching cost when the vendor’s pricing model changes.
Platform dependencies. AWS, Azure, GCP, the underlying cloud platform itself. The visible cost is the cloud bill. The hidden costs are the architectural decisions shaped by the platform’s primitives, the operational expertise required to use the platform’s services correctly, and the long tail of platform-specific services that accumulate across the system.
Partner integration dependencies. APIs from business partners, exchange protocols, EDI integrations and single-sign-on relationships. The visible cost is often nothing. The hidden costs are the engineer time required to maintain the integration, the operational risk of the partner changing terms, and the strategic lock-in that grows as the integration becomes load-bearing.
Each carries a Total Cost of Ownership. None is a single invoice line. The audit makes each visible.
The Five Hidden Costs
Every dependency above has the same five TCO components. These are the framework.
The acquisition cost. What was paid to bring the dependency into the system? For open-source libraries, this is roughly zero. For SaaS vendors, this is the initial subscription. For cloud platforms, this is the migration cost. Acquisition is the most visible component and the smallest contributor to TCO.
The integration cost. The engineer spent time wiring the dependency into the system. Configuration. Wrapper code. Adapter layers. Test infrastructure. Documentation for the team. Integration is paid up front, in engineer-weeks, and is almost never tracked back to the dependency that required it.
The maintenance cost. The recurring engineer time is required to keep the dependency current. Version upgrades. Security patches. Breaking changes. Compatibility works as adjacent dependencies evolve. This cost recurs every year for the dependency’s entire lifetime in the system. It is the largest TCO component for most dependencies and the least visible.
The lock-in cost. The increasing cost of switching away from the dependency as the system accumulates features specific to it. A small dependency with a small surface area is easy to switch. A dependency that has accumulated five years of integration code, schema decisions, and team expertise becomes a multi-quarter project to replace. Lock-in cost grows monotonically. The first year, it is near zero. The seventh year can be the highest single cost on the list.
The exit cost. The cost of removing the dependency entirely. Because the vendor sunset the product. Because the open-source project was abandoned. Because the license terms changed. Because the organization decided the dependency was no longer worth its TCO. Exit costs are often discovered the moment they become necessary, which is also the moment the organization has the least flexibility to absorb them.
Five costs. Every dependency carries all five. The accounting system tracks the first one, partially tracks the second, and completely ignores the last three.
Why None of This Appears on the Invoice
Cloud bills, SaaS invoices, and procurement ledgers track money flowing out of the organization. They do not track the engineer time consumed, the opportunity costs forfeited, or the strategic flexibility lost. The last three are the largest components of dependency TCO.
Maintenance lives inside the sprint capacity. When an engineer spends three days upgrading from React 17 to React 18, those three days get charged to the product roadmap, not to React. The dependency consumed engineering capacity. The capacity reduction shows up as missed product deadlines, not as a cost attributable to the dependency.
Lock-in lives inside opportunity cost. When the team chooses not to migrate from MongoDB to PostgreSQL because the migration would consume a quarter, the cost of MongoDB is the quarter of product work that did not happen. Opportunity cost does not appear on any spreadsheet. It appears in the strategic plan as “we should do that someday,” and then it never happens.
Exit cost lives inside panic. When Auth0 was acquired by Okta, and customers received pricing changes, the engineer time spent evaluating migration alternatives, the negotiation time spent extracting better terms, and the architectural reviews that suddenly became urgent were all costs of Auth0 as a dependency. None of them appeared on the original procurement spreadsheet. They arrived as an emergency, because the dependency’s economy changed.
This is the structural reason organizations underprice their dependencies. The visible costs run at 20% of TCO. The invisible costs run at 80%. The decisions that produce the dependencies get made based on the visible costs, because the invisible costs do not exist in any data system that the decision-maker can query.
The Compound Problem
A single dependency at $20,000 per year in fully-loaded TCO is not a problem. Twenty dependencies at $20,000 per year is $400,000 per year. Two hundred dependencies, which is normal for a mid-sized SaaS system once transitive packages, vendor services, and platform-specific integrations are counted, are $4 million per year in TCO that the organization has not priced.
No individual dependency was a mistake. Most of them were defensible decisions at the moment they were made. The compound problem lies in the aggregate: the organization has accumulated 200 defensible decisions whose combined cost has never been computed.
The first dependency rarely needs TCO analysis. The two-hundredth does, as do all before it. Without a dependency audit, real operating costs remain unseen.
The Worked Example
Take a typical mid-stage SaaS company’s use of a popular open-source ORM. The dependency itself is free. The annual TCO breaks down as follows.
Acquisition: $0.
Integration: 4 engineer-weeks at $250 per hour, fully loaded, equals $40,000; amortized over 5 expected years of use, equals $8,000 per year.
Maintenance: Average 2 engineer-weeks per year for upgrades, breaking changes, and ongoing schema migration support equals $20,000 per year.
Lock-in: Estimated as the engineering cost to migrate to a different ORM, multiplied by the probability of migration within 3 years. 12 engineer-weeks times $250 per hour times 30% probability equals $36,000; amortized, $12,000 per year.
Exit: Estimated as the engineering cost to remove the ORM entirely if the project were abandoned. 16 engineer-weeks times $250 per hour times 5% probability per year equals $8,000 per year.
Total annual TCO for one open-source ORM: $48,000 per year.
The organization’s accounting system shows $0 for this dependency. The audit shows $48,000.
The system has 15 dependencies of comparable scope, each with a similar TCO. The hidden cost of the ORM tier alone, before any SaaS vendor or platform dependency is counted, runs to $720,000 per year.
These are not invented numbers. They are the numbers organizations discover during a Dependency Audit. They are also the numbers that explain why engineering teams feel like they are running uphill even when headcount is growing. Most of the headcount is paying down the TCO of dependencies that nobody priced.
The Audit as a Practice
The audit operates at two scales. At design-review time, the architect applies it to any new dependency before adoption. At the engagement scale, the architect or CTO applies it across the full portfolio.
At design-review time, three questions are answered before any new dependency is added to the system.
What is the expected TCO over the next five years, broken into the five cost categories? Acquisition. Integration. Maintenance. Lock-in. Exit. A number with five components.
What is the simplest alternative, including building the capability internally, and what is its five-year TCO? The build-versus-buy question is reframed as a TCO comparison rather than a feature comparison.
What conditions would trigger a reconsideration? Vendor pricing changes beyond a defined threshold. Maintainer activity dropping below a defined floor. License terms are changing. Acquisition by a competitor. Named, in writing, in the Architecture Decision Record. The audit conditions for the next audit.
Three questions are written into every new ADR. The dependency does not enter the system without all three being answered.
At the engagement scale, the audit becomes a structured assessment. Inventory every dependency across the five categories. Compute TCO for each using the five-cost frame. Aggregate. Identify the dependencies whose TCO exceeds their measurable value. Make those candidates for removal or replacement.
The output is a ranked list of dependencies by TCO, with the value they deliver listed alongside the cost they incur. The list is uncomfortable. The organization that has never run an audit discovers that 15-25% of its dependencies have a TCO that exceeds the value they deliver. Those dependencies have been net negative for years. The audit is the first time anyone has computed the comparison.
What Every Audit Finds
Four findings repeat across every engagement.
The abandoned critical-path package. Every mature system has at least one. An open-source library that the team relies on, whose maintainer stopped updating eighteen months ago. The team has not noticed because the package still works. It will keep working until the runtime version underneath it goes out of support, at which point it will stop working in a way that requires a quarter to fix.
The vendor whose pricing model changed. Every system in production for more than 3 years has at least one vendor whose pricing model changed in a way that materially increased TCO. The organization absorbed the change because switching would have been more expensive than paying. The vendor knew this. The pricing model changed for exactly that reason.
The integration that nobody owns. Most production systems have at least one critical integration whose original implementer is no longer available, whose documentation is out of date, and whose runbook does not exist. The integration works. Nobody knows why. When it stops working, the organization will discover its TCO.
The duplicate dependency. Most production systems have at least one pair of dependencies that solve overlapping problems. One team adopted one. A different team adopted the other. Both are in production. Both carry ongoing TCO. The audit is the first time anyone has noticed.
Every audit finds all four. None of them appears on the invoice. All of them are large numbers.
For the CTO
The audit is a structured assessment of a system or portfolio’s full dependency surface. Inventory across all five categories. TCO calculation for each using the five-cost frame. Aggregate TCO across the portfolio. Identification of net-negative dependencies. Recommendation for which dependencies to remove, replace, or renegotiate.
A typical engagement runs for 4 to 8 weeks of structured work, depending on system complexity. The cost runs roughly 1-2% of the annual TCO that the audit will surface. The audit pays for itself within six months in identified savings.
The output is a document that the CFO can read. A ranked list that the engineering team can act on. A TCO baseline that the organization can track year over year. And the most valuable output: the discovery of which dependencies have been net negative for years, something nobody in the organization could have made without the audit.
Without the audit, the dependencies remain. The TCO continues to compound. Engineering capacity continues to be consumed by maintenance work that nobody attributes to the dependencies that require it. The cloud bill continues to grow. The strategic plan continues to underfund product work because the dependency cost is invisible.
The audit makes the invisible visible. The visibility is uncomfortable. The visibility is also the only thing that lets the organization make a different decision.
The Second Receipt
Every library, every package, every vendor, every platform on your stack has a Total Cost of Ownership. The TCO is real. It is being paid every year. It is being paid out of engineering capacity, out of opportunity cost, out of strategic flexibility, out of the cloud bill, and out of the SaaS invoice. The dependencies do not become free because the accounting system cannot price them.
The cloud bill is the receipt for 20% of the system’s actual cost to run.
The Dependency Audit serves as the receipt for the remaining 80%.
The organization that has never seen the second receipt has never seen what its system actually costs.