
Technical Debt Has an Interest Rate
And You’re Not Calculating It

The Loan Nobody Underwrote
A VP of Engineering reviews the last quarter’s output. The team shipped two features. The roadmap promised nine. The engineers were not idle. They were busy. They spent a third of their time dealing with maintenance on code that was never written to last. Another quarter of their hours went to workarounds and rework caused by accumulated shortcuts. By the time the quarter ended, fewer than half the engineering hours went to work that created value for customers.
Nobody approved this allocation. Nobody signed a loan document. The debt accumulated through hundreds of small decisions: a shortcut to hit a deadline, a dependency nobody updated, a test suite nobody maintained, a migration that started and never finished. Each decision was individually rational. Collectively, they created a debt burden that now consumes the majority of the team’s capacity.
The VP can see the symptoms. Features are late. Engineers are frustrated. The codebase is fragile. What the VP cannot see is the interest rate, because nobody has ever calculated it.
In 1992, Ward Cunningham coined the term “technical debt” to explain to his boss why the WyCash portfolio management system needed refactoring. He was deliberate about the financial analogy: “Shipping first-time code is like going into debt. A little debt speeds development so long as it is paid back promptly with a rewrite. The danger occurs when the debt is not repaid. Every minute spent on not-quite-right code counts as interest on that debt. Entire engineering organizations can be brought to a standstill under the debt load.”
The industry adopted the metaphor. It did not adopt the math. Thirty-four years later, teams talk about “technical debt” constantly and calculate it almost never. The metaphor became a vague handwave: “we have some tech debt we should address.” Nobody asks: how much? At what interest rate? What are the minimum payments? When does the debt become unsustainable?
Financial institutions would never operate this way. Every loan has a principal, an interest rate, a payment schedule, and a default threshold. This essay argues that technical debt has all four. And organizations that refuse to calculate them are running their engineering departments like someone who never opens their credit card statements.
The industry adopted Cunningham’s metaphor and refused to do his math. We talk about “technical debt” constantly and calculate it almost never.
Essay 1 in this series quantified the architecture tax. Essay 2 measured the opportunity cost. Essay 3 identified the principal-agent dynamics that generate the debt in the first place. This essay shows what happens to that debt over time. The answer is not accumulation. It is compounding. And compounding is the mechanism that turns manageable problems into organizational paralysis.
Taking the Metaphor Seriously
If technical debt is debt, then it has the same components as financial debt. Every organization already understands these components. The problem is that nobody has mapped them to software.
Principal: The Original Shortcut
In financial debt, principal is the amount borrowed. In technical debt, principal is the gap between what was built and what should have been built. The shortcut taken. The test not written. The refactoring deferred. The dependency not updated. The migration started and never finished.
Cunningham’s original formulation was narrow: principal was the gap between the team’s current understanding and the code that reflected an earlier, less mature understanding. Martin Fowler expanded it into a 2x2 matrix (Intentional vs. Unintentional, Prudent vs. Reckless), capturing four distinct ways principal accumulates. Steve McConnell distinguished intentional debt (strategic shortcuts with a repayment plan) from unintentional debt (the result of doing a poor job). For the purposes of this argument, principal is any code artifact that increases future development cost relative to the alternative that would have been built with sufficient time, knowledge, and discipline.
The critical insight: principal is invisible on the balance sheet. No accounting system tracks it. No quarterly report includes it. It exists only in the experience of the engineers who work with the code daily, which is why 63% of developers cite it as their top frustration at work while most executives cannot put a number on it.
Interest Rate: The Velocity Tax
Interest is what you pay for carrying debt. In financial terms, it is a percentage of the principal paid per period. In technical terms, it is the additional time every task takes because of the accumulated debt.
If a feature that should take two weeks takes three because of debt, the interest rate on that task is 50%. If every sprint loses a third of capacity to debt maintenance (the Stripe developer survey finding), the annualized interest rate on the team’s total debt is roughly 49%, because you are paying 33 cents on every dollar of capacity, continuously. McKinsey’s finding that high-debt organizations spend 40% more on maintenance and ship 25-50% slower suggests interest rates in the 40-100% range for severely indebted codebases.
The interest rate is not fixed. It increases as debt accumulates, because each new shortcut interacts with existing shortcuts, creating compound complexity. This is the critical difference between financial debt and technical debt. Financial interest rates are typically fixed or bounded. Technical interest rates accelerate. A codebase with ten shortcuts has more than ten times the complexity of a codebase with one, because shortcuts interact, creating failure modes and cognitive load that scale superlinearly.
Carrying Cost: The Minimum Monthly Payment
Carrying cost is the periodic payment required to service the debt without reducing the principal. In financial terms, it is the minimum monthly payment. In technical terms, it is the engineering time consumed each sprint by maintenance, workarounds, and rework caused by existing debt.
For a team of 10 developers at $150,000 average salary, a 33% carrying cost equals $495,000 per year in effectively wasted salary. That is the minimum payment: the cost of keeping the system running without improving it. If the team addresses no debt and ships no features, $495,000 per year goes to interest alone. And that figure does not include the opportunity cost (Essay 2) of the features those developers could have built instead.
Carrying cost is the metric that should alarm executives. It is measurable: track the percentage of sprint capacity consumed by debt-related work. It converts to dollars: multiply by team cost. And it trends upward, because debt compounds and carrying cost increases every quarter unless principal is actively reduced.
Default: When the Organization Stops Shipping
Financial default occurs when the borrower can no longer make minimum payments. Technical default occurs when the codebase becomes effectively unmaintainable: changes take so long and break so many things that the organization cannot ship at a rate sufficient to sustain the business.
CISQ estimates the cost of poor software quality in the United States at $2.4 trillion in 2022, with technical debt representing $1.52 trillion of that figure. The average enterprise carries $3.61 million in technical debt. Organizations reach technical default when they can no longer respond to competitive threats, regulatory requirements, or customer needs within commercially viable timeframes. The symptom is the “rewrite conversation”: the moment when leadership asks whether it would be cheaper to start over than to continue modifying the existing system. That conversation is the technical equivalent of bankruptcy proceedings.
Financial default occurs when you can no longer make minimum payments. Technical default occurs when all engineering effort goes to servicing existing debt and no new value can be created.
Why Technical Debt Compounds
Financial debt compounds because interest accrues on interest. Technical debt compounds through a different but equally destructive mechanism: debt begets more debt, because workarounds create new workarounds.
The Workaround Cascade
When a developer encounters debt, they have two choices: pay it down (refactor) or work around it (add another shortcut). Under time pressure, which is constant, they work around it. That workaround becomes new debt. The next developer encounters both the original debt and the workaround, and adds a third layer. Each layer increases the cognitive load required to understand the system, which increases the probability of the next shortcut.
This is compounding. The interest is not just the time lost to the original debt. It is the time lost to the original debt plus the time lost to every workaround built on top of it. A codebase with one layer of debt is manageable. A codebase with five layers of stacked workarounds is a system that nobody fully understands and everyone is afraid to change.
High-debt codebases typically produce two to three times more production bugs than well-maintained systems. Each emergency fix diverts development resources from planned work and carries premium costs from urgency and context-switching overhead. The bugs themselves are a form of interest payment: unplanned work caused by the accumulated principal.
The Compound Interest Formula, Applied
In financial math, compound interest follows a simple formula: the accumulated amount equals the principal multiplied by one plus the interest rate, raised to the power of the number of periods. Apply this to an engineering team.
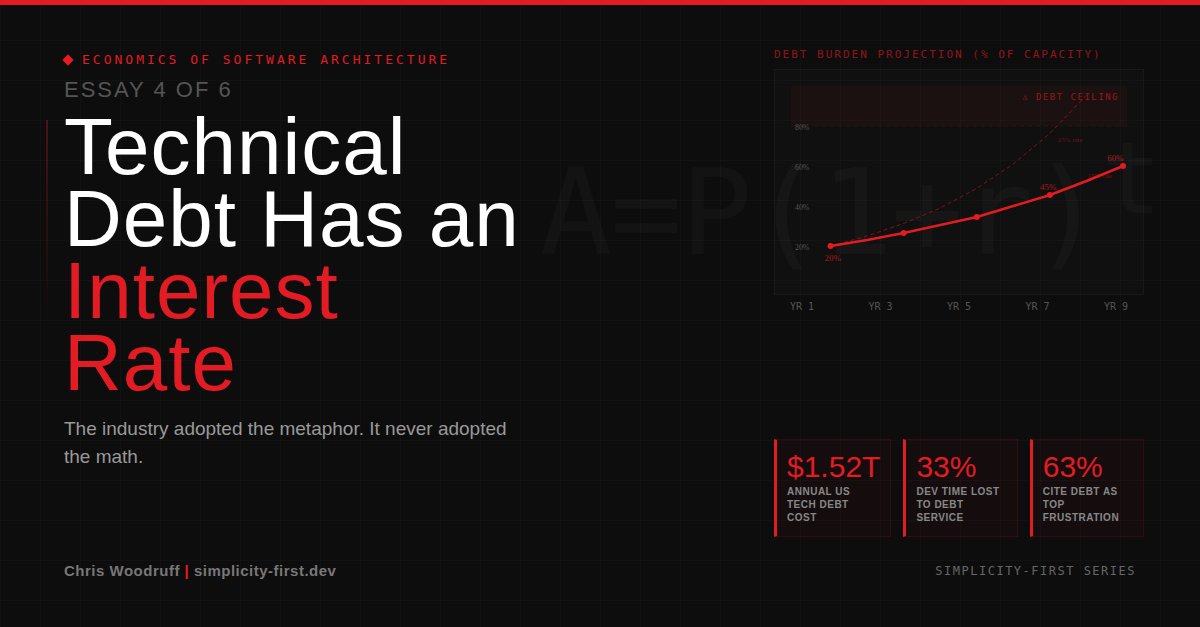
Start with a principal of 20% of sprint capacity consumed by debt in Year 1. Assume a 15% annual increase in debt burden, a conservative estimate based on the workaround cascade. After Year 1: 20%. After Year 2: 23%. After Year 3: 26.5%. After Year 5: 34.5%. After Year 7: 45.5%. After Year 10: 67%.
That trajectory takes a team from “we have some tech debt” to “we cannot ship anything meaningful” in under a decade. At average software system lifespans, this is not a theoretical risk. It is the default trajectory for any codebase where debt is not actively managed.
And 15% annual growth is conservative. Teams that skip tests, defer upgrades, and build on top of unfinished migrations often see carrying costs grow at 25-30% per year. At 25% growth, the same 20% starting debt reaches 95% in just nine years. Total organizational paralysis.
The AI Acceleration Factor
AI-assisted coding introduces a new compounding dimension. GitClear research found that code churn (code discarded within two weeks of being written) is projected to double with AI tool adoption. MIT professor Armando Solar-Lezama described AI coding tools as “a brand new credit card that is going to allow us to accumulate technical debt in ways we were never able to do before.”
The mechanism is straightforward. AI generates code faster, but it also generates debt faster. The principal accumulates at machine speed while the interest rate remains at human speed. Teams produce more code without proportionally more understanding of that code, creating what researchers call “latent debt”: complexity that hides behind automation until it surfaces as maintenance burden. The code works. Its intent and maintainability are unclear. And every line of code that a developer does not fully understand is a line that will cost more to modify later.
AI is a brand new credit card that allows us to accumulate technical debt in ways we were never able to do before. The principal accumulates at machine speed. The interest rate remains at human speed.
The Debt Ceiling
As carrying cost approaches 100% of engineering capacity, feature velocity approaches zero. The organization is paying all its engineers to keep the lights on. No new value. No competitive response. No growth. This is the debt ceiling, and it does not arrive as a sudden crash. It arrives as a gradual suffocation.
Each quarter, the percentage of capacity consumed by debt increases by a few points. The roadmap gets shorter. Feature estimates get longer. Thirty percent of CIOs report that more than 20% of their technical budget allocated for new products gets diverted to fixing debt. Seventy percent of technology leaders say technical debt is the number one cause of productivity loss. At the extreme, organizations describe teams where 80-90% of engineering time goes to maintenance and emergency fixes.
Then the best engineers leave. Seventy-eight percent of developers say that spending too much time on legacy systems has a negative impact on morale. Talented developers do not stay in codebases that frustrate them. Their departure accelerates the crisis: institutional knowledge walks out the door, and the remaining team’s ability to navigate the debt decreases. The interest rate climbs faster. The carrying cost jumps. The debt ceiling descends.
When organizations hit the debt ceiling, the instinct is to rewrite. Start fresh. Clean slate. But rewrites are themselves a form of debt: they require enormous upfront investment (principal), they carry risk of failure (default), and they consume years of engineering capacity that produces no user value until completion (carrying cost). The old system and the new system both demand maintenance simultaneously, doubling the debt burden during the transition. This is the rewrite trap, and it connects directly to Essay 6 in this series, where the sunk cost fallacy explains why these rewrites cannot be abandoned once started, even when they are clearly failing.
The Segment case study from Essays 1 and 2 is the positive counterexample. Segment recognized its debt ceiling approaching when three full-time engineers were spending all their time maintaining 140 microservices and zero time building product. They consolidated. Engineering velocity returned. But Segment is the exception. Most organizations do not recognize the approaching ceiling because nobody tracked the trajectory. The compound interest curve was never plotted.
Why Nobody Calculates It
If the math is this straightforward, why does almost nobody do it? Four reasons compound each other.
The Metaphor Became a Crutch
Cunningham’s metaphor was designed to communicate with non-technical stakeholders. It succeeded too well. “We have some technical debt” became a catch-all that replaced quantification. The metaphor gave teams a word for the problem without requiring them to measure it. “We have debt” sounds like a plan is possible. “We are paying 49% annual interest on $3.6 million in accumulated shortcuts” demands immediate action. The vague version is more comfortable. The precise version is more useful.
The People Who Create It Do Not Pay It
Essay 3’s argument applies directly here. The people who create technical debt (architects and developers who leave within two years) are not the people who pay the interest (the team that inherits the system). There is no incentive to calculate a debt you will not be present to service. Worse, quantifying the debt would make visible the cost of past decisions, which threatens the reputation of the people who made those decisions. Measurement is politically uncomfortable, and politically uncomfortable measurements tend not to get funded.
Measurement Is Hard (But Not Impossible)
Technical debt lacks the clean metrics of financial debt. There is no credit score, no balance statement, no interest rate ticker. But difficulty is not impossibility. DORA metrics track deployment frequency, lead time, change failure rate, and mean time to recovery, all of which degrade as debt accumulates. Sprint velocity trends over time reveal carrying cost. Bug-to-feature ratios show where effort goes. Onboarding time reveals cognitive load. The tools exist. The will to use them does not.
The Boiling Frog
Compounding is invisible in real time. A 15% annual increase in debt burden feels like a 1.2% increase per month. No single sprint reveals the trend. By the time the debt burden is visible in quarterly outcomes, the compound interest has already made the problem several times larger than it was when intervention would have been cheap. The debt ceiling arrives as a surprise because nobody tracked the trajectory. The quarterly review shows the symptoms (missed roadmap targets, slipping estimates, rising incident counts) without connecting them to the cause (compound interest on unmanaged debt).
A Debt Calculator You Can Use on Monday Morning
This is not meant to produce a precise figure. It is meant to produce a directionally correct number that is politically impossible to ignore. Approximate math beats no math every time.
Step 1: Measure the Carrying Cost
For three consecutive sprints, track the percentage of engineering time consumed by: maintenance of existing systems that is not feature work, workarounds caused by known debt, rework caused by code fragility, and emergency fixes (unplanned work). Average the three sprints. This is your carrying cost percentage.
Now multiply by annual engineering spend. If your team costs $1.5 million per year and 33% goes to debt service, your annual carrying cost is $495,000. That is not the total debt. That is the interest payment. The money your organization spends each year to keep the debt from getting worse, without making it any better.
Step 2: Estimate the Interest Rate
Compare the carrying cost percentage from the current quarter to the same quarter one year ago. If it increased from 25% to 30%, your annual interest rate is approximately 20%. If you do not have historical data, use the industry baseline: 15-25% annual increase for unmanaged debt. Codebases with active test suites, maintained dependencies, and completed migrations sit at the low end. Codebases with deferred upgrades, skipped tests, and half-finished migrations sit at the high end.
Step 3: Project the Debt Ceiling
Using the compound interest formula, project the carrying cost forward. If your carrying cost is 30% today with a 20% annual interest rate, it reaches 43% in two years, 52% in three years, 75% in five years, and 90% in seven years. Ninety percent means the team ships almost nothing.
Plot these numbers on a graph. Show it to leadership. The graph is the argument. No executive will look at a curve that shows their engineering team reaching 90% debt service in seven years and say “this is fine.” The problem was never that leadership did not care. The problem was that nobody showed them the curve.
Step 4: Calculate the Repayment Plan
Just as financial debt repayment requires payments that exceed the interest accrual, technical debt reduction requires capacity allocation that exceeds the carrying cost growth rate. If carrying cost grows at 20% annually and the team allocates 20% of sprints to debt reduction, the team is treading water. Not improving. Not declining. Spending effort with no net change.
To reduce principal, the team must allocate more than the growth rate. The 20% sprint allocation commonly recommended in the industry is a starting point, not a solution. Whether that allocation is sufficient depends on the interest rate. At a 10% interest rate, 20% allocation creates progress. At a 25% interest rate, 20% allocation barely keeps pace. The only way to know is to calculate.
The Simplicity-First Filters as Debt Prevention
Repayment is necessary for existing debt. Prevention is necessary for new debt. The three Simplicity-First filters, viewed through the debt lens, are underwriting standards for new architectural decisions.
The 2 AM Test prevents the most expensive category of debt: the kind that creates operational emergencies. Systems that a tired engineer cannot debug at 2 AM generate the highest-interest debt, because every incident creates urgent, unplanned work that displaces planned debt reduction. The Half-Rule prevents scope-driven debt. Build half of what you think you need. Validate it. Then decide whether the second half is worth the additional principal. Primary Path First prevents speculative debt. Design for the 95% case that generates business value. Contain the 5% edge case rather than building infrastructure to handle it. That 5% case generates 50% of the maintenance burden in many systems.
Prevention is always cheaper than repayment. An organization that applies these filters at decision time accumulates less principal, pays less interest, and never approaches the debt ceiling.
The industry recommends allocating 20% of sprints to debt reduction. Whether that is sufficient depends on the interest rate. And you cannot know the interest rate if you never calculate it.
What Comes Next
This essay has shown that technical debt compounds, that organizations rarely calculate the interest rate, and that the debt ceiling represents a real risk of organizational paralysis. Essay 3 identified the principal-agent dynamics that generate the debt. But there is another dimension of the problem that neither agency theory nor compound interest fully explains: why do cloud infrastructure costs spiral even when individual teams believe they are being responsible?
The answer is the tragedy of the commons. When infrastructure costs are pooled across an organization, no individual team feels the weight of their provisioning decisions. Each team over-provisions because the cost is absorbed elsewhere. The result is collective over-consumption of shared resources: $44.5 billion in projected cloud waste for 2025. Essay 5, “The Tragedy of the Cloud Commons,” applies Garrett Hardin’s commons economics to explain why cloud bills keep growing while nobody seems responsible.
Calculate Your Own Interest Rate
Here is the diagnostic exercise, paralleling the calculations from Essays 1-3.
Open a spreadsheet. Estimate the percentage of your team’s last three sprints that went to maintenance, workarounds, rework, and emergency fixes. That is your carrying cost. Now estimate how that percentage has changed over the past year. That is your interest rate. Now project it forward five years using the compound formula.
If the number at Year 5 makes you uncomfortable, you do not have a planning problem. You have a debt problem. And debt problems do not get better with time. They compound.
The architecture tax is what you pay. Opportunity cost is what you lose. Misaligned incentives are why you keep paying and losing. And compound interest is the mechanism that turns manageable debt into organizational crisis. Calculate the interest rate. The number is the argument.